Microsoft Clarity vs Harvv

Clarity shows you what happened. Harvv tells your AI why.

Clarity records video of your visitors and draws heatmaps of where they click, and it is genuinely good at that. You watch the recordings and read the maps yourself to work out what is wrong. Harvv does the working-out and hands the answer to your AI.

“Did anyone actually read it?”

Clarity answers

A scroll heatmap, showing how far down the page people got.

Harvv answers

7.3%

of the distance people scroll is slow enough to read. The other 92.7% goes past too fast for the words to land, including most of what you wrote.

Measured across 291,830 scrolls on 24 sites in the seven days to 6 August 2026, bots and internal traffic excluded. Reading speed is 50 to 200 px/s; above that the text cannot be taken in. It is a measurement of pace, so it proves the scroll was slow enough to read, not that anyone did.

01

Clarity MCP vs Harvv MCP

Five questions, put to both connectors on the same store on the same day. Identical wording, one word changed: which tool to use. Here is what Clarity answered, here is our answer to the same question, and here is where we go deeper.

We ran this twice. On 10 August, Clarity gave the better answer on two of the five, and both times it beat us because our own connector was broken, not because Clarity measured something we cannot. We fixed the bugs and asked the same five questions again. Both rounds are below, defects named, so you can check the claim rather than take it.

Q1Someone is fighting the cart. What is wrong?Split, both rounds+
Clarity repliedexcerpt

Short version: the cart page itself is basically fine. What’s broken is what happens right after the cart. People are getting bounced to an “items in your cart are no longer available” screen, and most of them leave for good.

44 mobile shoppers hit Shopify’s out-of-stock interruption page between cart and checkout. Desktop: 3. Of those 44, only 7 ended up buying. Mobile shoppers who reach checkout normally buy about 75% of the time.

Only 12 mobile sessions loaded /cart in three days. Across those: 1 dead click, 0 rage clicks, 1 JavaScript error. That’s clean.

On what it cannot see: which products or sizes triggered the out-of-stock screen. Clarity sees the page, not the line items.

Harvv repliedexcerpt

The cart page is not what is broken. The mobile problem happens before people ever get there. Only 800 to 1,100 of 96,000 sessions reached /cart at all, and on that page angry clicking is essentially zero: four stuck elements, one person each.

The one thing that genuinely touches the cart is a script failure. /cart.js, /cart/change.js and /cart/update.js are failing, the files that let the cart update without a page reload. When they do not load, the cart looks frozen or shows a stale total.

One caveat that matters: the browsers report these as never reaching a server, which is also exactly what an ad blocker produces. We cannot tell those apart. Before anyone spends money on this, load the cart on a phone with a clean browser and confirm it misbehaves. Two minutes, free.

The actual hole is on the product page. Two in three product-page visits never touch the size buttons, and those visits add to cart 0.9% of the time against 52.7% for visits that do pick a size. The non-pickers are mostly on phones and stop scrolling about a third of the way down.

You asked what is wrong with the cart. The cart is mostly a bystander. People are not getting stuck in it, they are not filling it in the first place.

Clarity returnedlist-session-recordings
{
  "link": "https://clarity.microsoft.com/player/…",
  "timestamp": "2026-08-09 15:56:43",
  "totalDuration": "23 seconds",
  "sessionClickCount": 15,
  "timeline": [{
    "url": "https://…/products/…",
    "LCP": "0s", "CLS": "0",
    "timelineEvents": [
      { "eventtype": "Click", "text": ".ajax-cart__item-remove ." },
      { "eventtype": "Click", "text": ".ajax-cart__item-remove ." },
      { "eventtype": "Click", "text": "-" },
      { "eventtype": "Click", "text": ".ajax-cart__item-remove--" },
      { "eventtype": "Click", "text": ".ajax-cart__item-remove ." },
      { "eventtype": "Click", "text": ".ajax-cart__item-remove ." },
      … 9 more, all the same control …
    ]
  }]
}
Harvv returnedget_friction_findings
{
  "id": "21887",
  "type": "conversion",
  "title": ""ajax cart item image wrapper" moves
            while people are pressing it",
  "element": "mobile:tap_abort:shift:div.ajax-cart__item-image__wrapper a",
  "priority": "medium",
  "sessions_affected": 14,
  "summary": "14 people on a phone put a finger on this and it
     moved out from under them before they let go, 14 times across
     13 pages. Their finger did not move and the page was not
     scrolling. The element itself shifted. This will not…",
  "status": "open",
  "dashboard_url": "https://harvv.com/app/site/…/issue/21887"
}
Where we go deeper

Both tools agree the cart page is clean. We go past that to why the cart is empty in the first place: two in three product-page visits never touch the size selector, and those visits convert at 0.9% against 52.7%. That is the largest measured gap on either side of this page, and it is a layout change, not a rebuild.

We also name the three failing cart endpoints, and then argue against acting on them until you have spent two minutes checking, because an ad blocker produces the identical signature and we cannot separate the two. Clarity still finds something we do not: the out-of-stock screen between cart and checkout, 44 sessions, 7 purchases. It sits on Shopify’s domain. See the section below on what changes when the store is connected.

Both rounds
Round 1 · 10 Aug

We named two controls inside the cart drawer that shift under a finger, 16 and 19 people. Accurate and shallow: it answered the question as asked and never questioned the framing. The size-selector gap was not in the answer at all.

Round 2 · 11 Aug

Leads by rejecting the premise, then ranks three actions cheapest first. Same connector, more of it wired together.

Q2Is my site fast?Harvv, both rounds+
Clarity repliedexcerpt

Not slow to load. But it is jumpy and sluggish to respond, and that is a different problem than the one you asked about.

Using 75th-percentile load time: product pages 1.48s, collection pages 1.70s, homepage 2.49s. Google’s “good” bar is 2.5s. Load speed is not costing you customers.

Layout shift is bad on collection pages. Worst at p75: /collections/the-patterns 0.93, /collections/tops 0.76, /collections/new-drops-restocks 0.65.

One note on units: Clarity returns layout-shift values as integers (930, 764). CLS is a unitless score, so I read these as thousandths. That is an inference from magnitude, not something the connector states.

Only about 57% of sessions reported any performance data, and coverage is lopsided. Clarity’s average load times are garbage; the homepage shows a 17-minute average because backgrounded tabs get counted.

Harvv repliedexcerpt

The site loads fine for most people, but it responds slowly for nearly everyone, and that is the part worth caring about. (108,149 real pageviews, bots excluded.)

Loading is mostly fine: main content at 1.68s at the 75th percentile, server response 522ms, both inside Google’s good bar. But 3.2% of pageviews took over four seconds, worst case 50. Most visitors get a fast page and a distinct minority get a terrible one, which points at something that renders conditionally rather than heavy images.

Responsiveness is the actual problem. The delay between a tap and the page reacting is 248ms at the median. Google’s good threshold is 200ms. Your median visitor is already worse than good. This is not a tail, it is everyone.

Pushing back on the framing: speed is the smaller story. 15 files are failing to load, confirmed by the browsers themselves rather than inferred. Failed scripts do not just slow things down, they can silently disable buttons.

Four things to discount: whether any of this costs you money, which I cannot tie. Whether broken scripts cause the slow responsiveness, which is my inference and not Harvv’s finding. And ignore our own slowest-pages list: each row rests on 3 to 6 pageviews. It is noise dressed as a ranking.

Clarity returnedper recording
{ "LCP": "3.3s", "CLS": "0", "pageLoadTime": 20883 }
{ "LCP": "1.2s", "CLS": "0", "pageLoadTime": 22735 }
{ "LCP": "1.9s", "CLS": "0", "pageLoadTime":  4053 }
{ "LCP": "0s",   "CLS": "0", "pageLoadTime":     0 }

Every recording opened reports CLS 0.
Harvv returnedget_performance
"cls": {
  "p75": "0.000",
  "good_under": 0.1,
  "poor_over": 0.25,
  "samples": 110788,
  "poor_count": 4876,
  "poor_pct": 3.8,
  "worst": "3.593",
  "bimodal": true,
  "distribution_note": "The percentile looks healthy but 3.8% of
     pageviews (4,876) are in Google's POOR band, worst 3.593. This
     distribution is bimodal, so the percentile is NOT representative.
     Do not report this metric as healthy. A split like this
     usually means something renders CONDITIONALLY (announcement bar,
     popup or app block, first-visit-only element, a hero that swaps
     on a cache miss) rather than a gradual cause like heavy images."
}
Where we go deeper

Both are telling the truth. The percentile really is zero, because most loads are perfect and the rest are catastrophic, and no percentile can show you that. We report the shape and name what causes that shape; Clarity had to infer its own units from magnitude and had data for 57% of sessions.

The deeper move is the last paragraph of our reply, where we tell you to ignore one of our own outputs. Our slowest-pages ranking looks authoritative and rests on 3 to 6 pageviews a row. A tool that will not mark its own weak output is asking you to find the weak parts yourself. Clarity’s per-page layout-shift breakdown is still finer than ours, and we only added the distribution field at all after a competitor’s raw recordings showed us a shape our own summary was hiding.

Both rounds
Round 1 · 10 Aug

Right about the bimodal shape, and it published a slow-page ranking built on 3 to 14 samples a page without saying so. The gloss admitted it; the answer did not.

Round 2 · 11 Aug

The caveat moved into the answer, where the reader is, rather than sitting in our commentary about it. It also separates measured from inferred by name.

Q3Where do I look for stock problems?Both, same SKU+
Clarity repliedexcerpt

Clarity does not know your inventory. What it can show is shoppers behaving exactly the way people behave when they land on a page and cannot buy what they came for.

Costley Jumpsuit — Ada. 24 people viewed it, 1 added to cart. The same jumpsuit in other colours converted 9 of 26 views and 12 of 50. Same product, same price, same photography.

Ignite Bra. 29 views, zero adds to cart across the whole style. On top of that, 3 people signed up for back-in-stock alerts on the Mod Mini Dot version.

Site-wide tell: shoppers clicked “Notify me when available” 28 times in three days, against 368 “Add to Cart” clicks.

Pushing back: the “product availability” field in Clarity gave me garbage. It listed your homepage and cart page as out-of-stock sessions. Do not rely on that filter.

Harvv repliedexcerpt

Harvv cannot see your stock. What it can show is where a sold-out marker was actually rendered on the page in front of visitors, which is a different thing but the useful one. 245 sessions across 12 pages.

Product pages, which are a far stronger signal than a collection tile: Bandit Shorties – Mod Mini Dot (18), Ignite Bra – Mod Mini Dot (14), Hot Cross Shorties – Raspberry (10).

The one that looks like a real problem is Bandit Shorties. 188 sessions on that page in three days and 72% of them ended their whole visit right there. Half actively interacted first, so they were not drifting past it. That is the shape of “the thing I want is not buyable”, not “the page is confusing”.

How you would know for certain in five minutes: open Shopify inventory for those three and look at per-variant quantities, specifically whether any are negative. Negative means oversold, which looks available, accepts an add-to-cart, then falls apart. That is exactly what bit Axel Off Road on Aug 9.

Do not over-read it: 245 sessions out of 54,606 product views. This is a go-check-these-SKUs finding, not an explanation for a soft month.

Clarity returnedlist-session-recordings
"timelineEvents": [
  { "eventtype": "Dead click", "text": "AXS", "start": "02:28" },
  { "eventtype": "Click", "text": "AXS", "start": "02:28" },
  { "eventtype": "Click", "text": "▫ Item(s)" }
]

One dead click on a size button, in one recording,
found by watching.
Harvv returnedget_page_friction
"inventory_signal": {
  "measured": true,
  "pages": [
    { "page": "/search",                  "sessions": 139 },
    { "page": "/collections/tops",        "sessions": 73 },
    { "page": "/collections/new-drops",   "sessions": 60 },
    { "page": "/collections/bras",        "sessions": 44 },
    … 8 more pages …
  ],
  "sessions": 545,
  "note": "A sold-out marker was rendered on 12 pages in this
     window. Check stock on these before treating their friction
     or bounce as a design problem.",
  "caveat": "Derived from the text rendered on the page, not from
     store inventory… Treat it as where to look first, not as
     stock truth."
}
Where we go deeper

This is the interesting one. Neither tool can see inventory, and both reached the same product and the same colourway, Ignite Bra Mod Mini Dot, from completely different signals. Clarity inferred it from behaviour. Harvv read the marker rendering on the page. Two methods, one SKU.

We go deeper by pairing the marker with what people did next: 188 sessions on Bandit Shorties, 72% ending their entire visit on it, half of them after actively interacting. A marker tells you a label rendered. The dead-end rate tells you it cost something. Then we name the five-minute check that settles it, including the negative-quantity case that no behavioural signal can reveal.

The gap still runs against us. Clarity’s strongest lead, Costley Jumpsuit Ada, is one we cannot see at all: when sizes are gone inside a variant picker no marker renders, so there is nothing to read. Clarity also reads “Notify me when available” clicks, 28 against 368 add-to-carts, and we do not. This is a question worth asking both tools.

Both rounds
Round 1 · 10 Aug

Marker read only, and the gloss promised we were “adding the behavioural half beside the marker read”.

Round 2 · 11 Aug

Half of that promise landed, composed by the model out of tools we already shipped rather than a new feature: the marker read joined to the page’s dead-end rate. The variant-picker blind spot is still open as #60621.

Q4Why do mobile visitors give up?Round 1: Clarity → Split+
Clarity repliedexcerpt

Most mobile visitors are not rage-quitting a broken site. They are glancing and going. That is a different problem, and it needs a different fix.

2 out of 3 mobile visitors (1,811) look at exactly one page and leave. Average time on that page: 71 seconds. Average mobile visit is 98 seconds; on desktop it is 265.

461 mobile sessions added something to cart. 258 bought. Roughly 200 filled a cart and walked — and they exited on product and collection pages, not checkout. That is a help-me-finish-shopping problem, not a broken payment form.

Rage clicking: 1 session out of 2,694. People are not furious. They are indifferent.

On what it cannot say: why anyone left in their own words. Price, sizing doubt and shipping cost are all invisible here.

Harvv repliedexcerpt

The data does not support the premise. Across 96,400 sessions, 82% on phones: only 8.5% left without doing anything at all. Average engaged time 34 seconds, and 65% actively tapped something. That is not a picture of people arriving and bailing. If sales dipped, the leaving is not happening on the way in.

A defect in our own numbers, before you use them:68,300 of those 96,400 sessions list tigerfriday.com itself as the referring source. That usually means single visits are being chopped into several sessions, which would make people look like they leave and return more than they do.

What is real on phones: the site takes 248ms to react to a tap, so it feels ignored and people tap again, 3,320 rage clicks in three days. A small slice gets a genuinely broken page, worst real visitor waiting 50 seconds. And taps that never register at all, 124 on the mobile menu, 22 on Add to Cart.

Do not let anyone sell you that last one as the cause of a revenue problem. It is a few dozen sessions. Also good news: the old hidden-menu-button issue shows zero hits, consistent with a fix.

Harvv says your site’s structure did not change in this window, so if sales moved, the cause is probably not on the site at all. Check stock on the sold-out products, and any price, promo or ad change. Tell me what happened off-site and I can tell you which of the above matters.

Clarity returnedlist-session-recordings
{
  "totalDuration": "01 minute and 39 seconds",
  "sessionClickCount": 26,
  "timelineEvents": [
    { "eventtype": "Click", "text": " ", "start": "01:37" },
    { "eventtype": "Click", "text": " ", "start": "01:40" },
    { "eventtype": "Click", "text": " ", "start": "01:43" },
    { "eventtype": "Click", "text": "View List", "start": "01:48" }
  ]
}

Three taps on a blank target in six seconds,
then the visitor moved on. One session.
Harvv returnedget_friction_findings
{
  "title": ""slideout trigger search" moves while people
            are pressing it",
  "element": "mobile:tap_abort:shift:button.slideout__trigger-search",
  "priority": "high",
  "sessions_affected": 70,
  "summary": "70 people on a phone put a finger on this and it moved
     out from under them before they let go, 72 times across 29 pages."
}
{ "title": "…taps on "slideout trigger mobile menu"",
  "sessions_affected": 110 }
{ "title": "…sliding off "jdgm carousel full review link"",
  "sessions_affected": 67 }
Where we go deeper

On 10 Aug Clarity won this outright and we published it. It won because our bounce field came back empty, so we could show the friction and not measure the exodus. A refusal to invent a number is the behaviour we build for, but a refusal is not an answer.

Now we measure it, and go one step past measuring it: we flag a defect in our own session counting in the same breath. 68,300 of 96,400 sessions self-refer, which inflates the denominator on every number in the reply, including ours. Neither tool volunteered anything like that in round 1.

Clarity still holds the half that matters most. It reported 461 mobile sessions adding to cart and 258 buying, so roughly 200 filled a cart and walked. We cannot say that, and the reason is below.

Both rounds
Round 1 · 10 Aug

“I cannot give you an actual leave rate for phones. Harvv did not populate the bounce figure for this window; it came back empty.

The defect

#60623 · get_traffic_summary returned an empty bounce rate. Ours, not a limit of the approach.

Round 2 · 11 Aug

8.5% left without interacting, 8,225 of 96,383 sessions, and the field now ships its own definition so the number cannot be quietly redefined: sessions with zero user-initiated events.

Q5Which pages are worst?Round 1: Clarity → Split+
Clarity repliedexcerpt

1. The checkout stock-problems screen. 48 sessions landed on it; only 20 bought. These are not browsers, they had a card out. Everything below is cheaper.

2. /search. A real JavaScript error fires here — Cannot read properties of null (reading ‘querySelector’) — 167 times across 12 sessions. Plus 71 quick-backs, the signature of results that do not match what was asked for.

On its own numbers: two do not reconcile, so do not build anything on them. Clarity reports 230 sessions reaching checkout but 364 sessions with a purchase. More purchases than checkouts is impossible. Use Shopify for conversion.

If you are looking at this expecting a design problem, the data does not support that. Your dead-click and rage-click counts are genuinely small.

Harvv repliedexcerpt

A correction to the framing first: the worst problem is not a page. It is site-wide, and a per-page ranking buries it.

Ranked #0: failed file requests on ~85% of sessions. 81,653 sessions, 466,057 failures, most recent a few hours ago. The affected files include your cart endpoints and eight product-tab scripts. Being straight with you: that signature also describes an ad blocker and we cannot tell them apart. 7,111 sessions still added to cart in the same window, so carts are not broadly dead, but the volume is too concentrated on cart endpoints to wave off.

1. Homepage. 326 sessions with friction, 199 rage clicks, 4.4x the rest of the site. Most of the raw volume is carousel arrows, which Harvv correctly excludes as normal repeated pressing. What survives is 47 clicks on the hero arrow across 34 sessions: the slideshow looks tappable and is not.

2. /search, your #2 page by traffic, with an open finding that the search toggle is covered by another element (1,868 sessions). 3. One product page with 26 rage clicks across just 5 sessions, the highest intensity anywhere. Small sample, so treat it as a lead, not proof.

Harvv shows 7,110 sessions adding to cart and 5 beginning checkout. That is a measurement gap, not a business result: checkout runs on Shopify’s domain where the pixel does not reach. Do not read it as 5 checkouts.

Clarity returnedlist-session-recordings
filters: {
  "date": { "start": "…", "end": "…" },
  "deviceType": ["Mobile"],
  "deadClickPresent": true
}
sortBy: "SessionClickCount_DESC"

A list of recordings matching the filter.
You pick the filter, then you watch.
Harvv returnedget_page_friction
// Round 1, 10 Aug. Carousel arrows counted as rage.
  { "page": "/", "rage_clicks": 1596, "sessions": 494 }

// Round 2, 11 Aug. Same page, same store.
"pages": [
  { "page": "/",                 "rage_clicks": 199, "sessions": 326 },
  { "page": "/search",           "rage_clicks":  46, "sessions": 6073 },
  { "page": "/collections/tops", "rage_clicks":  20, "sessions":   18 }
],
"worst_page": "/",
"excluded_as_repeat_press": [
  { "element": "button.flickity-button",
    "clicks": 629,
    "why": "A carousel arrow is MEANT to be pressed
       repeatedly. Counting it as rage buried the real
       finding on this page underneath a false one." }
]
Where we go deeper

On 10 Aug we lost this outright, and the reply audited us on the way past: a top finding claiming more sessions than the site has ever had, and three of our own tools reporting three different session totals for the same window. All three defects are fixed, and the round 1 numbers are left above so you can see the size of the correction.

We now go deeper by refusing the ranking. “Which pages are worst” assumes the worst thing is a page. It is not: failed requests touch ~85% of sessions across every page, and any per-page list hides that by construction. Then we argue against our own headline, because an ad blocker produces the same signature.

Clarity still leads with the more valuable item: the checkout stock screen, 48 sessions, 20 purchases. It also names an exact JavaScript error on /search that we do not surface. Its ranking led with money and ours led with reach.

Both rounds
Round 1 · 10 Aug

Top finding claimed 1,693,087 sessions affected on a store that gets ~96,000, measured eleven days earlier and presented as current. Homepage rage clicks read 1,596, nearly all of them carousel arrows.

The defects

#60644 impossible session count · #60622 repeat-press counted as rage · #60619 three tools, three session populations · #60443 windows offered wider than the data.

Round 2 · 11 Aug

Homepage rage clicks read 199, with the carousel exclusion stated in the payload rather than applied silently. Every tool now returns the same session population and says so. Nothing on the page claims a number larger than the site.

The one thing neither round fixed

Clarity ties behaviour to purchases. We do not, and it shows up in three of the five answers above: the out-of-stock screen with 44 sessions and 7 purchases, the 461 carts against 258 orders, the checkout screen with 48 sessions and 20 buys. Every one of those answers the question a store owner actually has, and ours all say some version of “that is a measurement gap, do not act on it”.

It is worth being exact about why, because the honest reason is less flattering than “Shopify will not let us”. We do receive the purchases. On a different store of ours where we checked this properly, we captured 169 of Shopify’s 178 completed checkouts over 14 days, and our session count landed within 3% of Shopify’s. Then zero of those 169 orders attached to a session, because the conversion rows carry an 8-character id and the sessions table stores up to 16. We capture the money and drop it on the floor.

That is case #47577, still open, and it is a column width plus a write path rather than a research problem. Clarity has no moat here. It finished an integration we left at 95%. Until we finish it, this is a real reason to run both.

These are real replies from real chats, run against one Shopify store, one connector each, same wording both sides. Round 1 on 10 August 2026, round 2 on 11 August after the defects named above were fixed; Clarity’s replies are round 1 and were not re-run, so its side is a day older than ours. They are excerpts: trimmed for length, never for meaning, and the passages least flattering to us were kept on purpose. The store is unnamed and every count is shifted for client privacy, so read them as proportions rather than exact figures. Switch to Show API responses for the raw JSON each connector returned underneath. Clarity is shown through its session-recording tool, which is its strength and what its connector does best.

Clarity hands you three things to interpret

All of them require a person

  • Another dashboard. One more set of charts to go and check.
  • Heatmaps. A coloured picture that only a human can read.
  • Session recordings. Video that someone has to sit and watch.

Harvv hands you one thing

A sentence you can act on

  • 1,842 people landed on your homepage, stayed 24 seconds, and never scrolled once. Your pricing, your proof and your call to action did not exist for them.
  • Each finding names the element and the page, and comes with the fix written out.
  • Your AI reads it directly over MCP, in ChatGPT, Claude or Copilot.
02

What changes when you connect the store

One connector tells you what is broken. It takes a second one to tell you what it cost. This is the same argument as the section above, run forward: instead of picking a tool, add one.

Harvv MCPbehaviour
sessions                    9,368
purchases captured            169
purchases joined to a session   0   <- the whole problem

We know a purchase happened. We cannot say
who it happened to, so we cannot tell you
whether the people who hit a given friction
bought or not.
Shopify MCPorders
sessions                          9,647
sessions_with_cart_additions        354
sessions_that_reached_checkout      244
sessions_that_completed_checkout    178
conversion_rate                   1.85%

The reached-checkout stage that every answer
above called "a measurement gap".
What the pair can answer that neither can alone

Every reply in the section above says some version of “the funnel shows 5 beginning checkout against 7,110 add-to-carts, that is a measurement gap, do not act on it”. With the store connected, that stage is simply present. The model does the join in the answer even while our database cannot do it in the rows.

Two levels, worth keeping apart. The aggregate join works today with no code: “two in three visitors never touch the size selector, and here is the conversion rate and which variants are actually out of stock.” The session-level join does not: naming what a specific finding cost needs #47577 closed first.

It also settles Q3 outright. Clarity’s own reply said it does not know your inventory and called its availability filter garbage; our reply said we read a label, not stock. Shopify just knows. Two tools guessing at inventory is worse than one tool that has it.

These figures are from a different store to the one in the section above – another Shopify client of ours, where both connectors are live and we could check the join properly. Same 14-day window on both sides. We have not re-run the five questions against a two-connector setup yet, so treat this as what the pair makes possible, not as a sixth head-to-head.

03

Getting Clarity data into your own AI

Two different things get called "AI" here, and only one of them is yours. Clarity has a chat assistant inside its own dashboard, and it has a Data Export API and MCP server, which is the route to ChatGPT, Claude, Copilot or anything else you run. This section is about that second route. Every limit below is one Microsoft publishes for it.

WhatMicrosoft ClarityHarvvWhy it matters
Requests your AI may make, per daysource10, per projectNo daily ceilingTen questions is a morning, not a workflow
A paid tier that lifts the capsourceNone existsNot the constraintNo self-service escape hatch
How far back the API will looksourcePrevious 1 to 3 daysYour full historyLast month is out of reach through this route
How much comes back per requestsource1,000 rows, no paginationThe complete answerA truncated answer still reads as complete
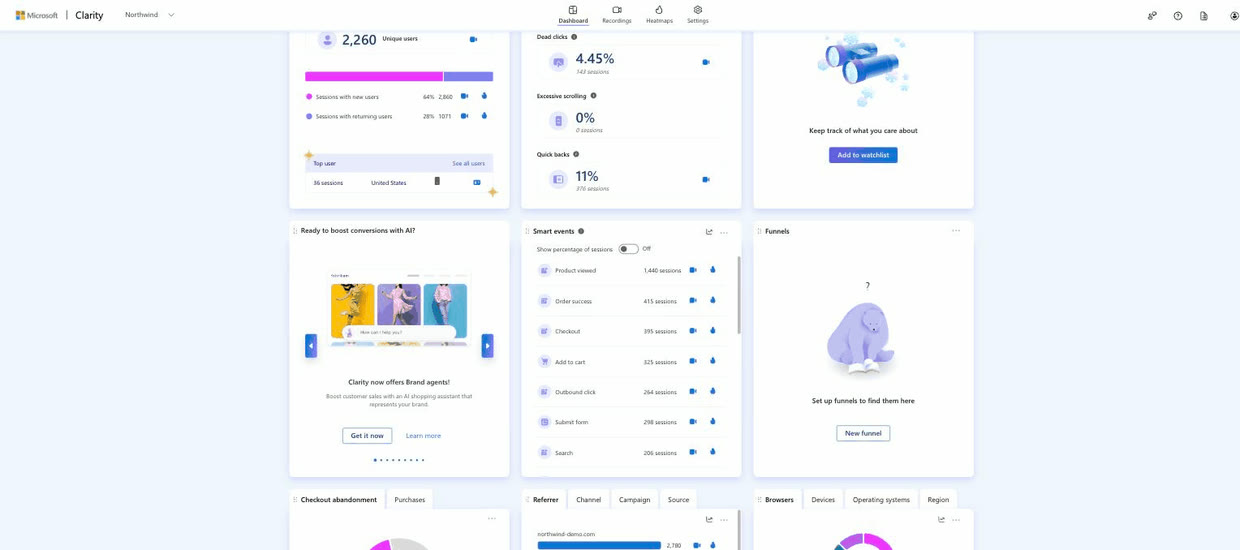
The Microsoft Clarity dashboard, showing its Insights panel with a dead-click percentage, a Smart events list, and Funnels.
Clarity's dashboard. It reports dead clicks and rage clicks itself, which is why neither appears in section 04 below. Project name and figures are anonymised; this is a picture of the product, not a reading of anyone's traffic.
04

Whose data is it

Clarity is free. Microsoft is the data controller, which is a different relationship from the one you have with a tool you pay for.

WhatMicrosoft ClarityHarvvWhy it matters
Delete one person’s datasourceDelete the whole projectNothing personal to deleteA deletion request you cannot honour
Healthcare and other sensitive sitessourceRestricted by their terms of useZero PII collected, by designRegulated sites cannot safely use it
Who controls the datasourceMicrosoft, as data controllerYou doFree, because the arrangement is not only about you
05

What Clarity is genuinely good at

Clarity is excellent at watching, and on two of these rows it is simply ahead of us. Here is what watching costs.

WhatMicrosoft ClarityHarvvWhy it matters
Video of real sessionssourceYes, and it is goodNo, by designSomeone still has to sit and watch them
How long the evidence lastssource30 days; favourites and a sample, 9 monthsNo video to expireEvidence can expire before the quarterly review
Your busiest dayssourceRecords up to 100,000 sessions per project per dayNo recording cap to hitBig sites lose exactly their biggest days
06

What a heatmap has nothing to draw

Clarity reports dead clicks and rage clicks on its own dashboard, so those are not on this list. These four are behaviours with no mark to place on a map: a tap that never happened, a swipe that reversed, a section reached but not read.

Read, skimmed, or skipped

A scroll heatmap tells you people reached the section. It cannot tell you whether anyone read it. We classify each block from scroll kinematics against its word count, so copy that is universally skipped shows up as skipped rather than as reached.

Taps that never committed

A finger lands on a control and lifts without pressing it. We separate a scroll flick from a target that moved, slipped, or wavered. Layout shifting under a thumb is invisible to Core Web Vitals, because transform-driven movement does not count toward CLS, and a click heatmap has nothing to draw for a tap that never happened.

Controls in the gesture dead zone

A button sitting in the back-swipe or home-indicator strip gets intercepted by the phone before your page sees the tap. It tests perfectly in a desktop browser and fails silently in a hand, and it renders as a cold spot rather than a defect.

Swipes that changed their mind

The shape of every swipe: direction, straightness, and how often a thumb reverses mid-gesture, tracked per element so a carousel is measured separately from the page behind it. A reversal is someone who did not find what they expected in that direction.

Left out, because we could not source it

A comparison page is the easiest place to publish something confidently wrong, so anything we could not tie to a first-party Microsoft source is not on this page:

Single sign-on. We could not find a Microsoft statement either way, so we make no claim about whether Clarity supports SSO.

Clarity’s site count. Third-party trackers disagree by roughly 50× and Microsoft publishes no figure, so we quote none.

Raising the API limits. Microsoft support says there is no self-service way and no paid tier, and also points enterprises at clarityms@microsoft.com to ask. We say the first part, which is documented, and not that it is impossible, which is not.

Clarity’s own chat assistant is not limited to three days. We had this wrong in the first version of this page and are saying so here rather than quietly editing it. Signed into Clarity we asked its built-in Copilot for a full month of history and it answered correctly, with the month’s session total and a dead-click table, filters showing 1–30 June. The 1-to-3-day window is a limit of the Data Export API, which is the route to your own AI, not of the assistant inside their dashboard. Section 01 is about that route and says so.

Common questions

Does Microsoft Clarity have an MCP server?

Yes. Microsoft ships a Clarity MCP server so an AI client can query your project, and it runs on the Data Export API, so it inherits that API’s limits: 10 requests per project per day, data from the previous 1 to 3 days only, and 1,000 rows per request with no pagination. Those are the numbers that decide whether your AI can actually work with the data, and they are documented by Microsoft.

What are Microsoft Clarity’s API limits?

Microsoft documents 10 API requests per project per day, a window covering only the previous 1 to 3 days, and a maximum of 1,000 rows per request with no pagination to fetch the rest. Microsoft support states there is no self-service way to raise them and no paid tier, though enterprises can email clarityms@microsoft.com to ask.

Is Microsoft Clarity really free?

Yes, it is free, and Microsoft is the data controller for it. That is a different relationship from a tool you pay for, and it has consequences you can look up: Microsoft’s own FAQ says you must delete the entire project to delete one user’s data, and Clarity’s terms restrict use with health care and other sensitive content. Free is a real advantage; it is just not the only number in the comparison.

What are some good alternatives to Microsoft Clarity?

It depends what you want out of it. If you want session video and heatmaps, Clarity is genuinely good and free, and Hotjar and Crazy Egg do the same job paid. If you want the problems found and written up so your AI can act on them without a daily request cap or a three-day window, that is what Harvv does, and it does not record video at all. Plenty of teams run one of each.

Is Harvv a replacement for Microsoft Clarity?

Not exactly. Clarity records video of sessions and draws heatmaps, and it is good at that. Harvv does not record video at all. Harvv detects the problems automatically and writes each one up in plain English, so the output is an answer rather than footage to review. Plenty of teams run both.

What are Microsoft Clarity’s AI and API limits?

Microsoft documents 10 API requests per project per day, data from the previous 1 to 3 days only, and a maximum of 1,000 rows per request with no pagination. Microsoft support states there is no self-service way to raise these and no paid tier, though enterprises can email clarityms@microsoft.com to ask.

Why does Clarity cost nothing?

Clarity is free and Microsoft is the data controller for it. That is a different relationship from a tool you pay for, and it is the reason individual-user deletion is not available: Microsoft’s FAQ says you must delete the entire project to delete one user’s data.

Does Harvv record my visitors?

No. Harvv captures behavioural signals (dead clicks, rage clicks, scroll depth, network failures, layout shifts) with zero personally identifiable information. There is no session video, so there is nothing to redact and nothing to expire.

See what Harvv finds on your site.

Point it at your URL and get the findings, each one naming the element, the page and the fix. No card, and no video to watch.

Start freeRun a free audit →

Free forever for 1 site. No credit card.